
From rising home prices to mortgage rate swings, the housing market has left a lot of people wondering what’s next – and whether now is really the right time to move. There is one place you can turn to for answers you want the most. And that’s the experts.
Leading housing experts are starting to release their market forecasts for the rest of the year. These insights will give you clarity – and a little more optimism than you might expect. Business Insider sums up the forecasts (and why they’re good news for you):
“As mortgage rates go down this year, affordability may improve slightly for homebuyers. Inventory is also expected to grow, which should help moderate price growth and make finding a home easier.”
Let’s break it down.
1. Mortgage Rates Should Come Down (Slightly)
While a major drop isn’t on the table, forecasters are calling for a modest decline in rates in the months ahead as the economic outlook becomes more certain. Based on the information we have right now, here’s a look at where they say rates should be by year-end (see graph below):
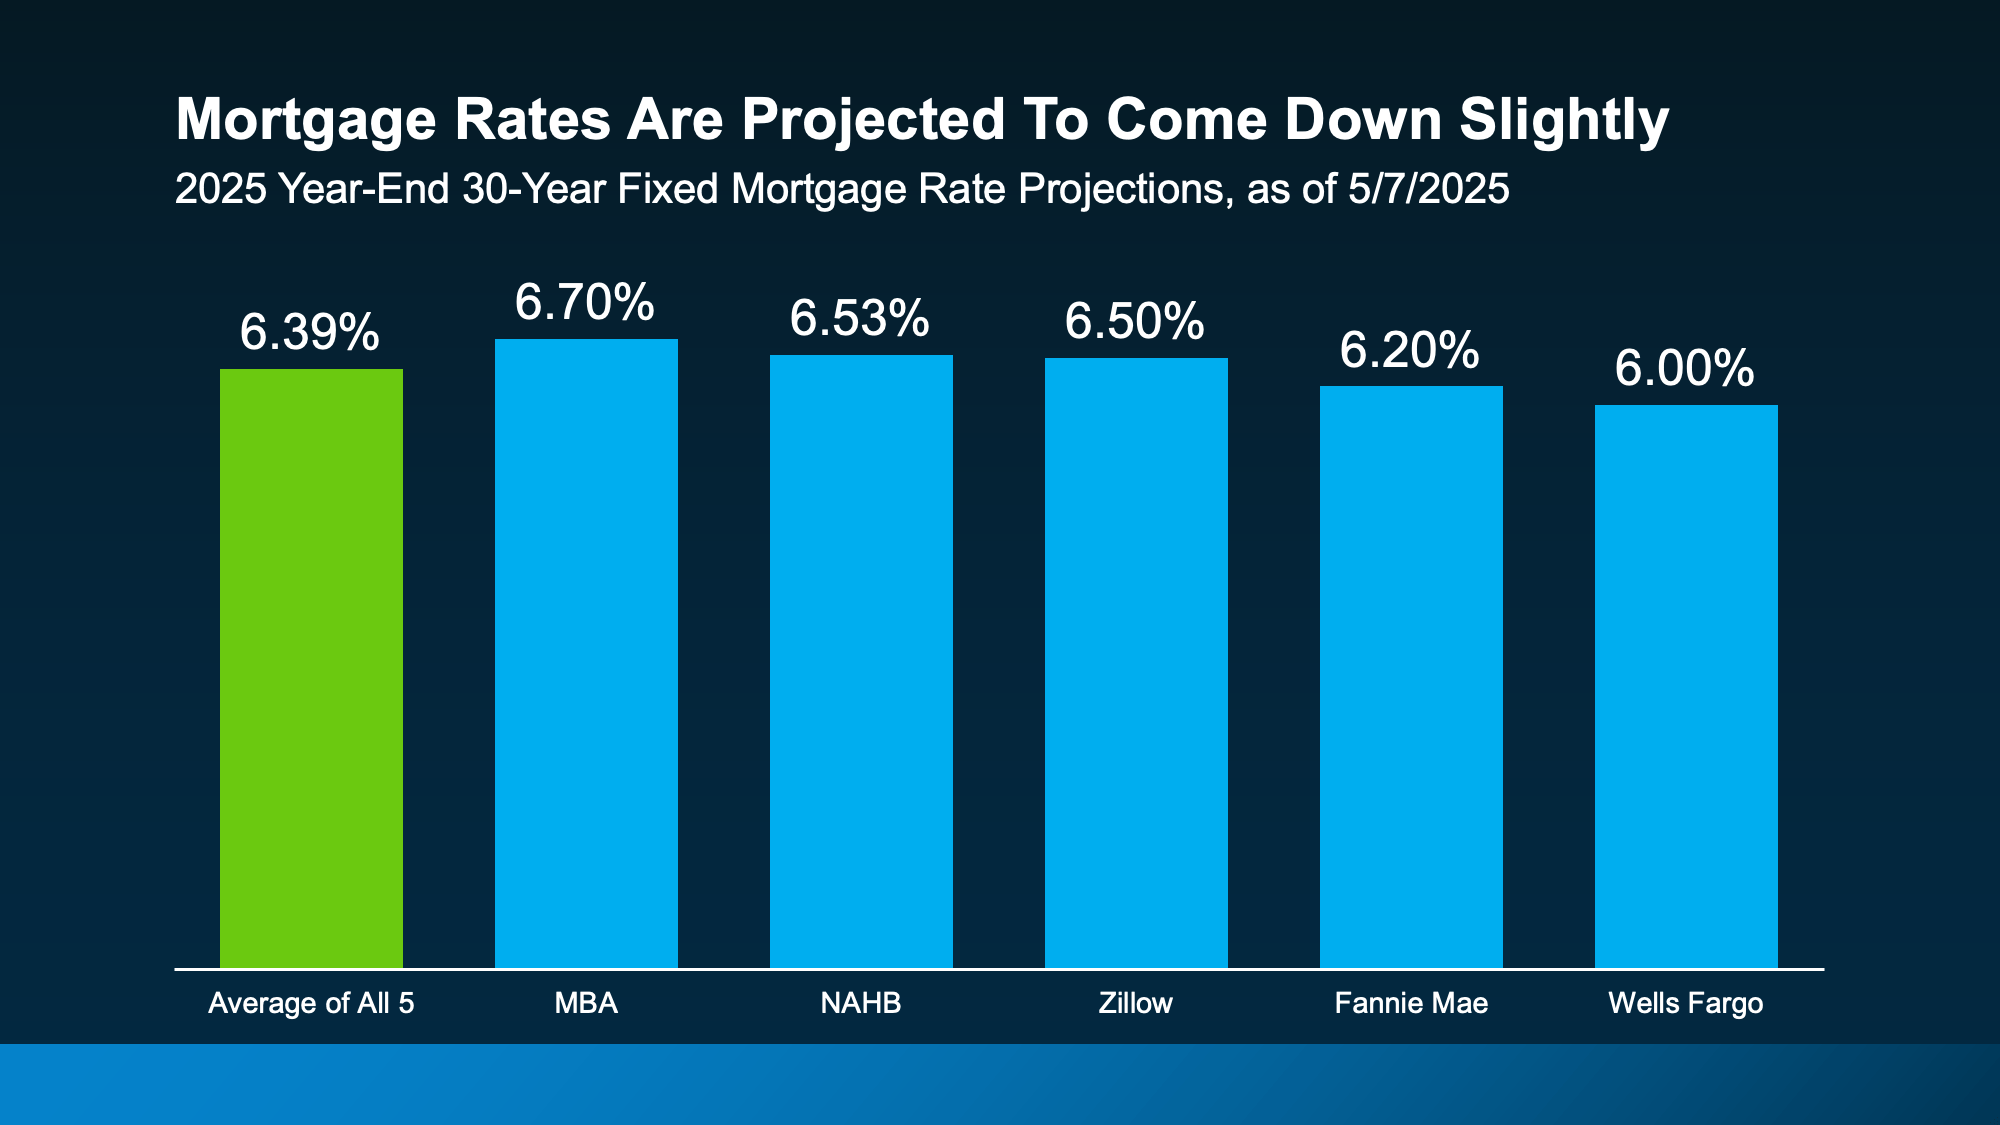
Even this slight decrease is a welcome change. A seemingly small decline can still help bring down your future mortgage payment and give you a bit more breathing room in your budget.
Just remember, everything from inflation to employment and broader economic shifts will have an impact on where rates go from here. So, don’t try to time the market. And do expect some volatility along the way.
2. Market Forecasts Predict Inventory Will Continue To Grow
Inventory has already improved a lot this year. A big portion of the growth the market has already seen is because homeowners are getting tired of sitting on the sidelines. They’ve tried the wait and see approach with rates, and it hasn’t really paid off. And at a certain point, you need to move no matter what the market is doing. This is one reason more homes have been listed lately. And experts say that should continue. As Lance Lambert, Co-founder of ResiClub, says:
“The fact that inventory is rising year-over-year . . . strongly suggests that national active housing inventory for sale is likely to end the year higher.”
If rate forecasts pan out as the experts say, that could be enough to tip some more sellers off the fence and back into the market – giving you even more options for your move.
3. Home Prices Are Moderating
As more homes hit the market, there will also be less upward pressure on home prices. Expert forecasts are still calling for growth, but the pace of that growth is slowing down as inventory climbs. The average of all 7 forecasts shows prices will rise about 2% this year (see graph below):
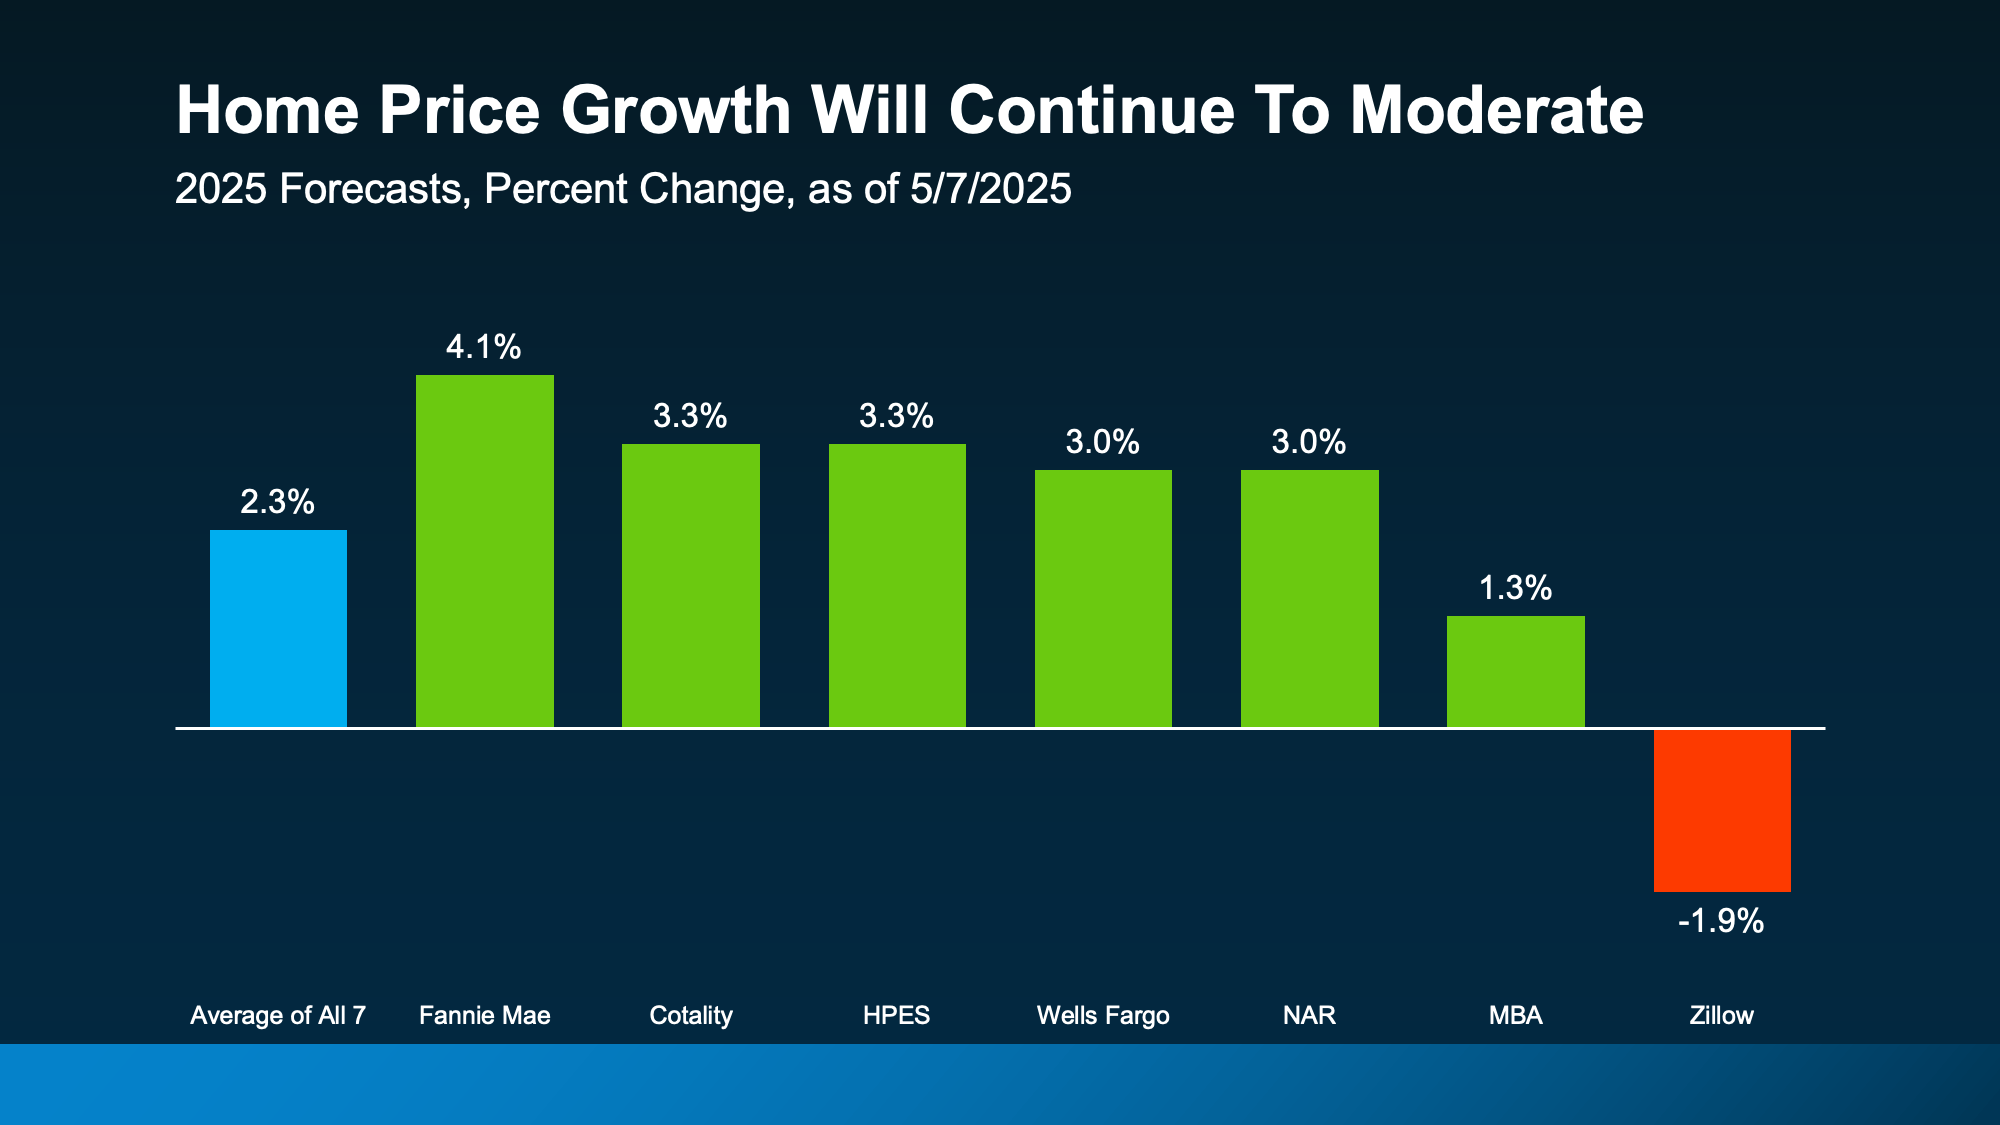
That means you could finally get a little bit of relief from rapidly rising home prices. When you combine the forecast for healthier price growth with projections for slightly lower mortgage rates, that could mean more buying power in the months ahead.
Keep in mind, though, the housing market is hyper-local. So, this is going to vary by area. Some markets will see prices climbing higher. And some may even see prices dip a little if inventory is up significantly in that location. So, lean on a local agent for insights into what’s happening in your area.
Bottom Line
So, if you want or need to move this year, know that the experts say things should start looking up. Let’s connect so you can take advantage of any market shifts that work in your favor.
For a more granular forecast, check out our post on 5 Things That Could Make or Break Your Home Offer This Summer.
If you’re ready to jump into the market, reach out to us to buy or sell a home!